Lighthouse gives a page a green score on your laptop, and then Search Console reports that the same page fails Core Web Vitals on mobile. Neither tool is broken. Lighthouse ran one synthetic test; Search Console summarizes what real visits felt like on real phones and networks. When they disagree, the real visits win, for Google Search and for your users.
Core Web Vitals boil that experience down to three numbers, each tied to a familiar frustration: a hero image that takes forever (LCP), a button that seems dead (INP), and a link that jumps away as you tap it (CLS). Below I explain what each measures, why field and lab data disagree, and how I measure and fix each metric, ending with a prioritized checklist.
What the Core Web Vitals measure
Google assesses each metric at the 75th percentile of visits, separately for mobile and desktop, so three out of four visits must meet the threshold. A page passes when all three metrics do. web.dev's overview has the full definitions.
| Metric | Measures | Good | Needs improvement | Poor |
|---|---|---|---|---|
| LCP | Loading | ≤ 2.5 s | 2.5 s to 4 s | Over 4 s |
| INP | Responsiveness | ≤ 200 ms | 200 ms to 500 ms | Over 500 ms |
| CLS | Visual stability | ≤ 0.1 | 0.1 to 0.25 | Over 0.25 |
Largest Contentful Paint (LCP)
LCP is the time from the start of navigation until the largest element in the viewport renders: an image, a video poster, a CSS background image, or a block of text. The browser stops updating it once the user taps, scrolls, or presses a key.
Interaction to Next Paint (INP)
INP measures responsiveness over the whole visit: for each click, tap, and key press, the time until the next frame is painted. That time has three phases:
- Input delay: waiting for the main thread to finish other work.
- Processing duration: running your event handlers.
- Presentation delay: style, layout, and paint for the next frame.
A page's INP is roughly its slowest interaction (one outlier is ignored per 50 interactions), so one sluggish menu can define it. INP replaced First Input Delay (FID) as a Core Web Vital in March 2024. FID only measured the first interaction's input delay, and the web-vitals library dropped onFID in version 5.
Cumulative Layout Shift (CLS)
CLS measures how much visible content moves unexpectedly. Each shift is scored by how much of the viewport moved and how far. Shifts less than a second apart are grouped into windows of up to five seconds, and CLS is the worst window's total. Shifts within 500 ms of a tap, click, or key press don't count.
Field data vs. lab data
Lab data comes from a controlled, reproducible test: Lighthouse, in DevTools or PageSpeed Insights, loads the page once on an emulated mid-range phone with a throttled network.
Field data comes from real visits. The Chrome User Experience Report (CrUX) aggregates it from opted-in Chrome users over a rolling 28-day window. It's what PageSpeed Insights shows above the lab results, what Search Console reports, and what Google Search uses.
They disagree for predictable reasons:
- Devices and networks. Lighthouse tests one profile; your users bring every kind of phone and connection.
- Caches. Lab runs are cold loads, while real visits include warm caches and near-instant back/forward cache restores.
- Behavior. A standard Lighthouse run doesn't click or scroll, so it can't measure INP (it reports Total Blocking Time instead) and misses later shifts.
- Coverage. CrUX only includes Chrome on desktop and Android.
Field data shows me what fails and where; lab tools show me why.
Measuring real users with the web-vitals library
CrUX lags by weeks, can't split results by page template or release, and has no URL-level data for low-traffic pages. Real user monitoring (RUM), collecting field data yourself, fixes all three. The web-vitals library from the Chrome team measures each metric the way Chrome does and handles tricky cases like background tabs and back/forward cache restores. I'm using version 6.
npm install web-vitalsThis module collects the three metrics and sends them in one request with navigator.sendBeacon() when the page is hidden:
import { onCLS, onINP, onLCP } from 'web-vitals';

// Metrics belong to the URL the visit started on. In a single-page app the
// user may be on another route when they're sent, so capture it up front.
const page = location.pathname;
const queue = [];

function enqueue(metric) {
  queue.push({
    name: metric.name, // 'LCP', 'INP', or 'CLS'
    value: metric.value, // ms for LCP and INP; a unitless score for CLS
    delta: metric.delta, // change since this metric's previous report
    rating: metric.rating, // 'good', 'needs-improvement', or 'poor'
    id: metric.id, // unique per metric per page view
    navigationType: metric.navigationType, // 'navigate', 'reload', ...
    page,
  });
}

function flush() {
  if (queue.length === 0) return;
  // The browser delivers the beacon even if the page is being unloaded.
  navigator.sendBeacon('/api/vitals', JSON.stringify(queue));
  queue.length = 0;
}

onLCP(enqueue);
onINP(enqueue);
onCLS(enqueue);

// 'hidden' covers tab switches, app switches, and navigating away, and
// unlike unload it fires reliably on mobile.
addEventListener('visibilitychange', () => {
  if (document.visibilityState === 'hidden') flush();
});
Three details matter:
sendBeaconsends a string body astext/plain, so the server must parse the JSON itself.- A metric can be reported more than once per page view, such as after a tab switch; summing
deltaperidgives its final value in any arrival order. onCLSonly works in Chromium browsers;onLCPandonINPalso work in current Firefox and Safari, so expect some mismatch with CrUX.
Here's a minimal Next.js route handler to receive it:
export async function POST(request: Request) {
  let reports: unknown;
  try {
    // sendBeacon sends string bodies as text/plain, so parse the JSON here.
    reports = JSON.parse(await request.text());
  } catch {
    return new Response('Invalid JSON', { status: 400 });
  }
  if (!Array.isArray(reports)) {
    return new Response('Expected an array of reports', { status: 400 });
  }

  // Replace with an insert into your database or analytics pipeline.
  console.log(JSON.stringify(reports));
  return new Response(null, { status: 204 });
}
Then compute the 75th percentile per metric, page template, and device type to see where to start.
Fixing LCP
Find the LCP element and its slowest phase
A DevTools Performance recording marks the LCP element. You can also paste this into the console:
new PerformanceObserver((list) => {
  const entries = list.getEntries();
  const lcp = entries[entries.length - 1]; // the latest candidate wins
  console.log(`LCP: ${Math.round(lcp.startTime)} ms`, lcp.element);
}).observe({ type: 'largest-contentful-paint', buffered: true });
Check a phone-sized viewport too; the mobile LCP element often differs. Then see where the time goes across four phases:
- Time to first byte (TTFB): until the first byte of HTML arrives.
- Resource load delay: until the LCP image starts downloading.
- Resource load duration: the download itself.
- Element render delay: until the element is painted.
Text elements skip the resource phases. A recording's Insights sidebar and the attribution build both show this breakdown; start with the largest phase.
Make the LCP image discoverable and high priority
Resource load delay is where I most often find wasted time. The preload scanner finds an <img> in the server HTML early, but the browser may still fetch it at a lower priority until layout shows it matters. fetchpriority="high" fixes that, while loading="lazy" on the hero delays the request until layout:
<img src="/hero.jpg" alt="Sales dashboard" loading="lazy">
<img src="/hero.jpg" alt="Sales dashboard" width="1200" height="675" fetchpriority="high">
Use fetchpriority="high" for the LCP image only; when everything is urgent, nothing is.
A CSS background or an image rendered by JavaScript is invisible to the preload scanner. Render it as an <img> in the server HTML if you can, or preload it:
<!-- A CSS background image: preload the exact URL the stylesheet uses -->
<link rel="preload" as="image" href="/hero.avif" fetchpriority="high">

<!-- A responsive image rendered by JavaScript: match its srcset and sizes -->
<link
  rel="preload"
  as="image"
  imagesrcset="/hero-640.avif 640w, /hero-1280.avif 1280w, /hero-1920.avif 1920w"
  imagesizes="(min-width: 1200px) 1200px, 100vw"
  fetchpriority="high"
>
A mismatched preload downloads the image twice, so check the Network panel.
Send fewer bytes
Next, shrink the download. Serve AVIF or WebP (every current major browser supports both), and let srcset and sizes pick a file sized for the slot so phones don't download a desktop hero:
<picture>
  <source
    type="image/avif"
    srcset="/hero-640.avif 640w, /hero-1280.avif 1280w, /hero-1920.avif 1920w"
    sizes="(min-width: 1200px) 1200px, 100vw"
  >
  <img
    src="/hero-1280.jpg"
    srcset="/hero-640.jpg 640w, /hero-1280.jpg 1280w, /hero-1920.jpg 1920w"
    sizes="(min-width: 1200px) 1200px, 100vw"
    width="1200"
    height="675"
    alt="Sales dashboard"
    fetchpriority="high"
  >
</picture>
fetchpriority goes on the <img>, not the <source>.
Cut time to first byte
TTFB is the floor under every other phase; web.dev's rough guide is 0.8 seconds or less. To cut it:
- Cache HTML at a CDN, even briefly or with
stale-while-revalidate. - Cache expensive queries at the origin (see caching strategies with Redis).
- Remove redirect chains (http → https → www); each hop is a round trip.
- Stream the HTML so the
<head>and its resource hints arrive early.
Unblock rendering: CSS, scripts, and fonts
Element render delay means the content is ready but something blocks the paint:
- Render-blocking CSS. Keep first-screen CSS small by splitting it per route and dropping unused rules.
- Synchronous scripts. A
<script>in the<head>withoutdefer,async, ortype="module"blocks parsing. - Anti-flicker snippets. A/B testing tools that hide the page until experiments load add that time straight to LCP.
- Web fonts. Most browsers hide text for up to about three seconds while its font loads. Use
font-display: swaporoptional, self-host, and preload first-screen fonts:
<link rel="preload" href="/fonts/inter-var.woff2" as="font" type="font/woff2" crossorigin>Keep crossorigin even on your own origin: fonts are fetched in CORS mode, so without it the preload goes unused and the font downloads twice.
Fixing INP
Find the slow interaction
Find the slow interaction with the attribution build or the Performance panel, which lists each interaction's latency as you click around, then record a trace to see the long tasks (over 50 ms) behind it. Match the dominant phase to a fix:
- Input delay: other work was running. Break it up or defer it.
- Processing duration: your handlers do too much. Respond first, defer the rest.
- Presentation delay: the frame is expensive. Shrink the DOM, virtualize long lists, and use
content-visibility: autooffscreen.
Break up long tasks by yielding
JavaScript runs to completion, so during a long task the browser can't respond or paint. Split the work into chunks and yield to the main thread between them.
scheduler.yield() is built for this, resuming your function ahead of other pending tasks of the same priority. It shipped in Chrome and Edge 129 and Firefox 142, but Safari doesn't support it, so feature-detect it and fall back to setTimeout:
export function yieldToMain() {
  if (globalThis.scheduler?.yield) {
    return scheduler.yield();
  }
  // Fallback for browsers without scheduler.yield(), such as Safari.
  return new Promise((resolve) => setTimeout(resolve, 0));
}
The fallback puts your continuation at the back of the task queue, and nested timeouts get clamped to at least 4 ms, but it still lets input and rendering through. For big batches, yield when a time budget runs out, not after every item:
import { yieldToMain } from './yield.js';

export async function processInChunks(items, processItem, options = {}) {
  const { budgetMs = 50, signal } = options;
  let deadline = performance.now() + budgetMs;

  for (const item of items) {
    processItem(item);
    if (performance.now() >= deadline) {
      await yieldToMain();
      signal?.throwIfAborted(); // stop if the result is no longer needed
      deadline = performance.now() + budgetMs;
    }
  }
}Respond first, defer the rest
In an event handler, do the work the user is waiting to see, then yield. Analytics, saving, and prefetching can wait:
import { yieldToMain } from './yield.js';

addToCartButton.addEventListener('click', async () => {
  cart.add(product);
  cartBadge.textContent = String(cart.count); // what the user is waiting to see
  await yieldToMain(); // give the browser a chance to paint first
  saveCart(cart);
  analytics.track('add_to_cart', { productId: product.id });
});
The code after the await runs as a separate task, so the browser gets a chance to paint first.
Run less JavaScript during load
Input delay during load usually means hydration or third-party scripts: the page looks ready, but a tap waits for the framework to attach its handlers.
- Ship less code. Drop unused dependencies, split by route, and load rare components with dynamic
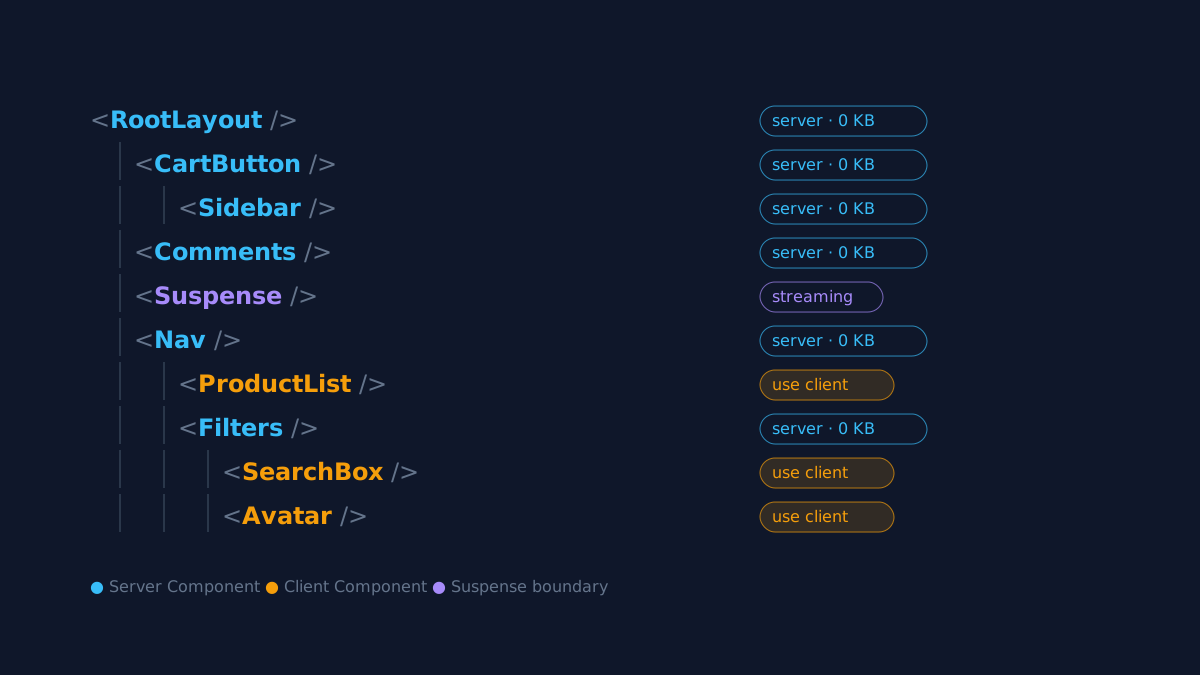
import(). - Hydrate less. React Server Components (the Next.js App Router default) ship no JavaScript for non-interactive components, and Astro islands hydrate only interactive parts. Since React 18,
<Suspense>boundaries hydrate independently, prioritizing what the user touches. - Defer third parties. Load tag managers, chat widgets, and session recorders with
asyncordefer, after load, or on intent.
Debounce expensive input handlers
Search-as-you-type is a classic INP trap: every keystroke filters a big list and re-renders it. Let the browser update the text field immediately, and run the expensive part once typing pauses:
function debounce(fn, waitMs) {
  let timer;
  return (...args) => {
    clearTimeout(timer);
    timer = setTimeout(() => fn(...args), waitMs);
  };
}

const updateResults = debounce((query) => {
  renderResults(filterProducts(query)); // the expensive part
}, 200);

searchInput.addEventListener('input', (event) => {
  updateResults(event.target.value);
});
A short wait for results beats a laggy text field (in React, useDeferredValue has a similar effect). Debouncing reduces how often work runs, not how long it takes: if one pass still blocks, chunk it or move it to a Web Worker.
Fixing CLS
Layout shifts happen when something resizes or appears after its surroundings render. DevTools recordings show what moved, and nearly every fix is the same: reserve space before the content arrives.
Give media explicit dimensions
Put width and height attributes on every <img>. Browsers derive the aspect ratio from them and reserve the box before the file arrives, as long as your CSS lets the height scale. An <iframe> gets no aspect ratio from its attributes, so set one in CSS:
img {
  max-width: 100%;
  height: auto; /* scale with the width, keeping the ratio from the attributes */
}

.video-embed {
  width: 100%;
  height: auto;
  aspect-ratio: 16 / 9; /* reserve the box before the iframe loads */
}

.ad-slot {
  min-height: 250px; /* the most common creative height for this slot */
}
Reserve space for ads and embeds
Ads are a classic culprit: the slot starts at zero height, and the creative shoves the article down. Reserve the most likely size with min-height, as .ad-slot does above, and show a placeholder rather than collapsing an unfilled slot. Treat embeds, maps, and comment widgets the same way.
Prevent font swaps from moving text
When a web font replaces its fallback, different metrics make text reflow and push content down. Two fixes:
font-display: optionalgives the font about 100 ms; if it misses that, the fallback stays for the page view and the cached font appears on later pages. No swap, no shift, though first-time visitors may not see your font.- A metric-matched fallback keeps
swapbut sizes a local font to take up the same space:
@font-face {
  font-family: 'Inter';
  src: url('/fonts/inter-var.woff2') format('woff2');
  font-weight: 100 900;
  font-display: swap;
}

/* Illustrative values: generate real ones for your font pair. */
@font-face {
  font-family: 'Inter Fallback';
  src: local('Arial');
  size-adjust: 107%;
  ascent-override: 90%;
  descent-override: 22%;
  line-gap-override: 0%;
}

body {
  font-family: 'Inter', 'Inter Fallback', sans-serif;
}
Generate the values: next/font does it automatically, and Fontaine or Capsize work elsewhere. local() only finds installed fonts. Stable Safari supports size-adjust but not the three override descriptors yet, so the correction there is partial.
Don't insert content above existing content
Banners injected at the top after load (cookie consent, app promos) and items prepended to a feed push everything down. Overlay them with position: fixed, reserve their space in the server HTML, or insert them below the viewport. Responding to a tap is fine, since shifts within 500 ms of input don't count. And animate with transform, not top or height: transforms never cause layout shifts.
A prioritized fix checklist
Here's my order on an unfamiliar site, cheapest high-confidence fixes first. Re-measure with your own data after each change, since CrUX takes up to 28 days to catch up.
| Priority | Fix | Metric | Effort |
|---|---|---|---|
| 1 | Collect field data, split by template and device | All | Low |
| 2 | Drop loading="lazy" from the LCP image; add fetchpriority="high" | LCP | Low |
| 3 | Set width and height on images, aspect-ratio on embeds | CLS | Low |
| 4 | Server-render or preload the LCP image | LCP | Varies |
| 5 | Reserve space for ads, embeds, and banners | CLS | Medium |
| 6 | Serve AVIF or WebP with srcset and sizes | LCP | Medium |
| 7 | Preload key fonts; add a metric-matched fallback | LCP, CLS | Medium |
| 8 | Respond first in event handlers, then yield | INP | Medium |
| 9 | Defer third-party and non-critical scripts | INP, LCP | Medium |
| 10 | Cache HTML at the edge; remove redirects | LCP | Medium to high |
| 11 | Break up long tasks and reduce hydration | INP | High |
Key takeaways
- Core Web Vitals are judged at the 75th percentile of real visits: LCP ≤ 2.5 s, INP ≤ 200 ms, and CLS ≤ 0.1.
- Field data decides and lab data explains. Collect your own with web-vitals and
sendBeacon. - For LCP, find the element and its slowest phase, then fix discovery and priority before bytes and TTFB.
- For INP, yield with
scheduler.yield()(falling back tosetTimeout), respond before background work, and ship less JavaScript. - For CLS, reserve space for everything that arrives late: images, embeds, ads, fonts, and banners.
None of these fixes is exotic; most are a few lines of HTML or CSS. The hard part is knowing which one your users need, so measure first, then fix the biggest phase of your worst metric.